일반적으로 불경기에 매출이 감소하면 대부분 먼저 줄이는 비용이 광고판촉비이다. 매출수수료나 물류비 등 일반적인 변동비들은 손댈 필요도 없이 매출대비 자동적으로 감소하는데, 광고판촉비는 가장 큰 비율을 차지하는 비용이기도 하고, 매출대비 변동비적 성격을 가지고 있지만 고정비이기도 하기 때문이다.
특히 광고비를 매월 1천만원을 책정했다면 이는 매출실적과 상관없이 매월 나가는 비용으로 고정비 성향이 강하기 때문에, 임의적으로 통제를 하는 것이다. 그래도 안되면 대표적인 고정비에 손을 대는데, 최후의 수단으로 가장 큰 고정비인 인원을 줄이는 것이 비용을 크게 줄일 수 있기 때문이다.
여기서 내가 중요하게 말하고 싶은 것은 매출감소나 증가에 따른 비용의 통제가능성이다. 만약 경영자가 손익계산서를 매월 파악하지 않는다면, 당연히 불가능한 일일 것이다.
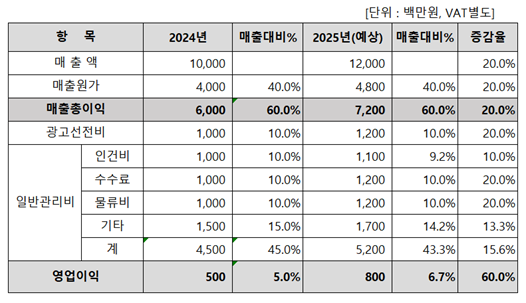
그래서 매출총이익율 다음으로 적정 수준의 판관비율을 머리속에 항상 파악하고 있어야 한다. “매출총이익-판관비=영업이익”이므로, 이는 곧 영업이익율과 직결되기 때문이다. 회사의 영업이익율 목표가 10%라면, 매출총이익율이 60%일 때 판관비율은 50%가 될 것이다.
그러나 사례에서 2024년에 판관비율이 55%라서 영업이익율은 5%로, 회사가 원하는 10%를 달성하지 못했다. 따라서 회사는 2025년 영업이익율 목표를 6.7%로 개선하는 걸 목표로 하면서, 판관비율을 53.3%로 감소시키면서 순차적으로 10%가 되기를 원하는 목표를 세운 것이다.
2025년 수치를 보면, 매출목표를 20% 증가시키면서 광고판촉비도 20% 늘렸는데, 경비율을 보면 매출대비 10%로 변함이 없다. 즉, 매출만 증가된다면 광고판촉비도 10%선에서 변동비적인 성격으로 정한 것이다.
반면 인건비는 10% 증가시켰지만 경비율은 9.2%로 감소했고, 기타 관리비도 금액은 증가했지만 14.2%로 감소하는 계획을 설정했다. 즉, 비용을 늘렸어도 매출성장을 통해 규모의 경제 효과로 고정비율이 감소하는 것이다. 이것이 중요한 포인트이다.
M사의 CEO는 매출이 감소한다고 무작정 감으로 광고비도 줄이고 인건비도 줄이려고만 했기 때문에, 오히려 매출이 더 감소하는 악순환이 된다는 사실을 몰랐다. 바로 손익계산서를 습관처럼 보지 않았기 때문이다.
이처럼 적정 수준의 원가율, 매출총이익율, 판관비율, 영업이익율은 경영자가 반드시 숙지해야 할 기본적인 수치이며, 3개월 롤링 포케스팅(Rolling Forecasting)을 통해 매월 체크하고 관리해야 할 일이다.
3개월 롤링 포케스팅은 전월, 당월, 익월 3개월의 손익계산서를 매월 한 표에 보는 것이다. 앞서 손익계산서 예시에서 2개년을 3개월로 바꾸면 된다. 만약 이번 달이 5월이면, 4월(실적)/5월(예상)/6월(계획)을 하고, 6월이 되면 5월(실적)/6월(예상)/7월(계획)을 하는 걸 매월 반복하면 된다.
이를 통해 경영자는 매출과 비용, 이익에 대한 변화의 흐름을 파악하고 앞으로 계획을 예측하고 수립함으로써, 가고자 하는 목적지에 이탈하지 않고 잘 운전해서 씽씽 달릴 수가 있을 것이다.
——————
In general, during economic downturns, the first cost that is often reduced is advertising and promotional expenses.
Variable costs like sales commissions and logistics costs decrease automatically in proportion to sales, so there is no need to adjust them manually. However, advertising and promotional expenses, while variable relative to sales, also have a fixed cost component, often making them one of the largest cost items.
For instance, if you budget 10 million KRW for advertising every month, this cost is fixed and incurred regardless of sales performance, which means it has a strong fixed cost characteristic. Therefore, this expense is something you can control if necessary.
If that’s not enough, you may need to address the fixed costs, and as a last resort, reduce labor costs, which are often the largest fixed cost, as cutting staff can significantly reduce expenses.
What I want to emphasize here is the ability to control costs in response to sales fluctuations. If a manager does not regularly review the PL statement, this would be impossible.
That’s why, in addition to the gross profit margin, it’s crucial to always have an appropriate level of SG&A ratio in mind. Since “Gross Profit – SG&A = Operating Profit,” this directly impacts the operating profit margin.
If the company’s target operating profit margin is 10%, then with a gross profit margin of 60%, the SG&A ratio would need to be 50%. However, in the previous example from 2024, the SG&A ratio was 55%, resulting in an operating profit margin of only 5%, which fell short of the company’s desired 10%.
Therefore, the company set a goal for 2025 to improve the operating profit margin to 6.7% by reducing the SG&A ratio to 53.3%, with the ultimate aim of gradually reaching 10%.
Looking at the 2025 figures, the sales target was increased by 20%, and advertising and promotional expenses were also increased by 20%, but the expense ratio remained unchanged at 10% of sales. This means that as long as sales increase, advertising and promotional expenses are managed as a variable cost at a 10% level.
On the other hand, labor costs were increased by 10%, but the expense ratio decreased to 9.2%, and other administrative costs also increased in absolute terms but decreased to 14.2% as a percentage of sales.
This illustrates the effect of economies of scale, where the fixed cost ratio decreases as sales grow. This is a crucial point. The CEO of Company M did not realize that arbitrarily cutting advertising costs and labor in response to declining sales would lead to a vicious cycle of further sales decline. This was because they did not review the PL statement regularly.
Thus, understanding appropriate levels of cost ratio, gross profit margin, SG&A ratio, and operating profit margin is essential for managers, and these figures should be monitored and managed monthly through a 3-month rolling forecast.
A 3-month rolling forecast is a table that shows the PL statement for the previous month, the current month, and the next month, all in one view each month. This is similar to the 2-year PL statement example given earlier, but condensed into 3 months. For example, in May, it would show April (actual), May (forecast), and June (plan), and in June, it would show May (actual), June (forecast), and July (plan), repeating this process every month.
Through this, managers can understand the trends in sales, costs, and profits, predict and establish future plans, and navigate smoothly toward their goals without veering off course.