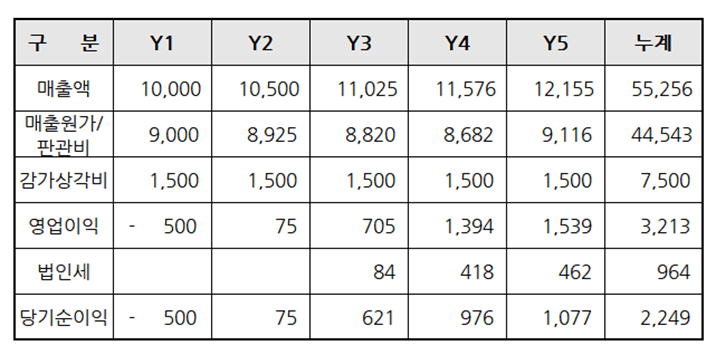
한 기업이 시설투자 60억원, 개발비 15억원, 총 75억원을 투자하려고 한다. 초년도 매출액은 10억원이고 매년 5% 증가 예상되며 운전자금은 매출액대비 5%로 책정하여, 아래와 같은 5개년 손익계산서가 예상되었다. 이때 감가상각비는 투자금액의 내용년수 5년 정액법으로, 법인세는 영업이익의 30%로 가정하였고, 금액단위는 백만원이다.
손익계산서에 의거하여 다음과 같은 현금흐름표를 작성했다.
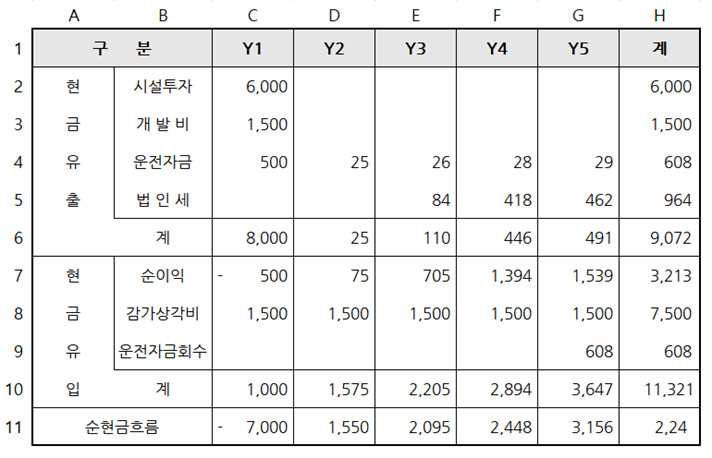
이 현금흐름표를 엑셀 시트에 작성하여, 아래의 방법으로 직접 따라해보면 더욱 이해하기 편할 것이다. 참고로 회사기준 가중평균자본비용(WACC)은 년 12%이고 투자금 회수기간(PBP)을 4년이내라고 가정하겠다.
- IRR: 엑셀함수 IRR(C11:G11) = 10.8%
- NPV: 엑셀함수 NPV(12%,D11:G11)+C11 = – 198백만원.
원래 NPV는 첫번째 해(Y1)의 순현금흐름 금액(C11)을 빼야 하는데, 현금흐름표상에 C11이 -7,000으로서 (-)로 표시되어 있기 때문에, NPV공식에는 +C11로 계산하였다. WACC는 예제에서 12%로 이미 주어져 있다.
- PBP: 투자회수기간은 현금흐름표상 -7,000백만원을 회수할 수 있는 기간으로 (1,550+2,095+2,448)-7,000 = -907 이다. -907은 5차년도 3,156의 28.7%를 점유하므로, 이를 개월로 환산하면 3.4개월이 나온다. 따라서 -7,000백만원의 PBP는 4년 4개월이다.
분석결과 PBP는 회사기준 4년 대비 투자회수 기간이 길어서 좋지 않고, IRR 10.8%는 WACC 12% 보다 작으므로 투자 수익성도 좋지 않다. 또한 NPV -198백만원도 0보다 작으므로 순현재가치도 좋지 않기 때문에, 이 투자는 하지말아야 함을 알 수 있다.
지금까지 PBP, IRR, NPV에 대해서 알아봤는데, 어느 한가지만을 보고 투자에 대한 의사결정을 하기 보다, 이 세가지 3종세트를 한꺼번에 검토하여 종합적인 의사결정을 하는 것이 좋다. PBP는 산업, 시장, 회사내부의 상황에 따라 기준이 달라질 수 있으므로, 회사의 기준을 설정하여 그 기간 내에 들어오면 된다. 그리고 IRR과 NPV는 별개의 것으로 보는 것보다, 두 가지를 하나로 이해하여 투자 여부를 결정하는 것이 좋다.
즉, IRR > WACC, NPV > O : 투자집행
IRR < WACC, NPV < O : 투자거부
IRR = WACC, NPV = O : 투자 보류
그외 여러 경우의 수가 있겠지만, 이는 전적으로 경영자의 최종선택에 따를 것이다. 다만, 상기 3종세트 분석을 하였다면, 분명 투자 판단의 큰 실수는 없을 것이다.
——————–
A company is considering an investment of 6 billion KRW in facilities and 1.5 billion KRW in development costs, for a total investment of 7.5 billion KRW. The first-year sales are expected to be 1 billion KRW, with a 5% annual growth rate. The working capital is set at 5% of the sales, and the following 5-year income statement is projected. Depreciation is calculated using the straight-line method over 5 years, and corporate tax is assumed to be 30% of operating profit, with all amounts in millions of KRW.
Based on the income statement, the following cash flow statement was prepared.
It would be easier to understand if you created this cash flow statement in an Excel sheet and followed along with the methods outlined below. For reference, the company’s Weighted Average Cost of Capital (WACC) is assumed to be 12% per year, and the Payback Period (PBP) is set at 4 years.
- IRR: Excel function IRR(C11) = 10.8%
- NPV: Excel function NPV(12%,D11)+C11 = -198 million KRW.Typically, the first year’s net cash flow amount (C11) should be subtracted when calculating NPV. However, since C11 is -7,000 in the cash flow statement, it is added in the NPV formula. The WACC is already given as 12% in the example.
- PBP: The investment recovery period is the time required to recover the -7,000 million KRW shown in the cash flow statement. The calculation is as follows: (1,550 + 2,095 + 2,448) – 7,000 = -907. This -907 represents 28.7% of the 5th year’s 3,156, which translates to 3.4 months. Therefore, the PBP for the -7,000 million KRW is 4 years and 4 months.
The analysis results show that the PBP exceeds the company’s 4-year criterion, which is unfavorable. The IRR of 10.8% is less than the WACC of 12%, indicating poor investment profitability. Additionally, the NPV of -198 million KRW is less than 0, meaning the net present value is also unfavorable. Therefore, this investment should not be pursued.
So far, we have reviewed PBP, IRR, and NPV. Rather than relying on just one of these metrics for investment decision-making, it is advisable to consider all three together for a comprehensive decision. The PBP criterion can vary depending on the industry, market, and internal company conditions, so it is essential to establish a company-specific standard and ensure the investment falls within that period. It is also better to consider IRR and NPV together rather than separately when deciding on an investment.
- IRR > WACC, NPV > 0: Proceed with the investment
- IRR < WACC, NPV < 0: Reject the investment
- IRR = WACC, NPV = 0: Postpone the investment
There may be other scenarios, but ultimately the final decision rests with management. However, conducting the above 3-in-1 analysis will help avoid significant mistakes in investment decisions.